Restaurant Budget Template
Enter the month's sales, food and drink cost percentage, labor percentage, occupancy and other costs; you get prime cost, profit and a P&L table to print or download as CSV.
The restaurant budget template on this page is a one-month profit and loss worksheet. You type in your sales for the month, your food and drink cost, labor, occupancy and other costs, and it works out your prime cost, total costs, profit and margin. It runs in your browser, is free, needs no sign-up, and uploads nothing.
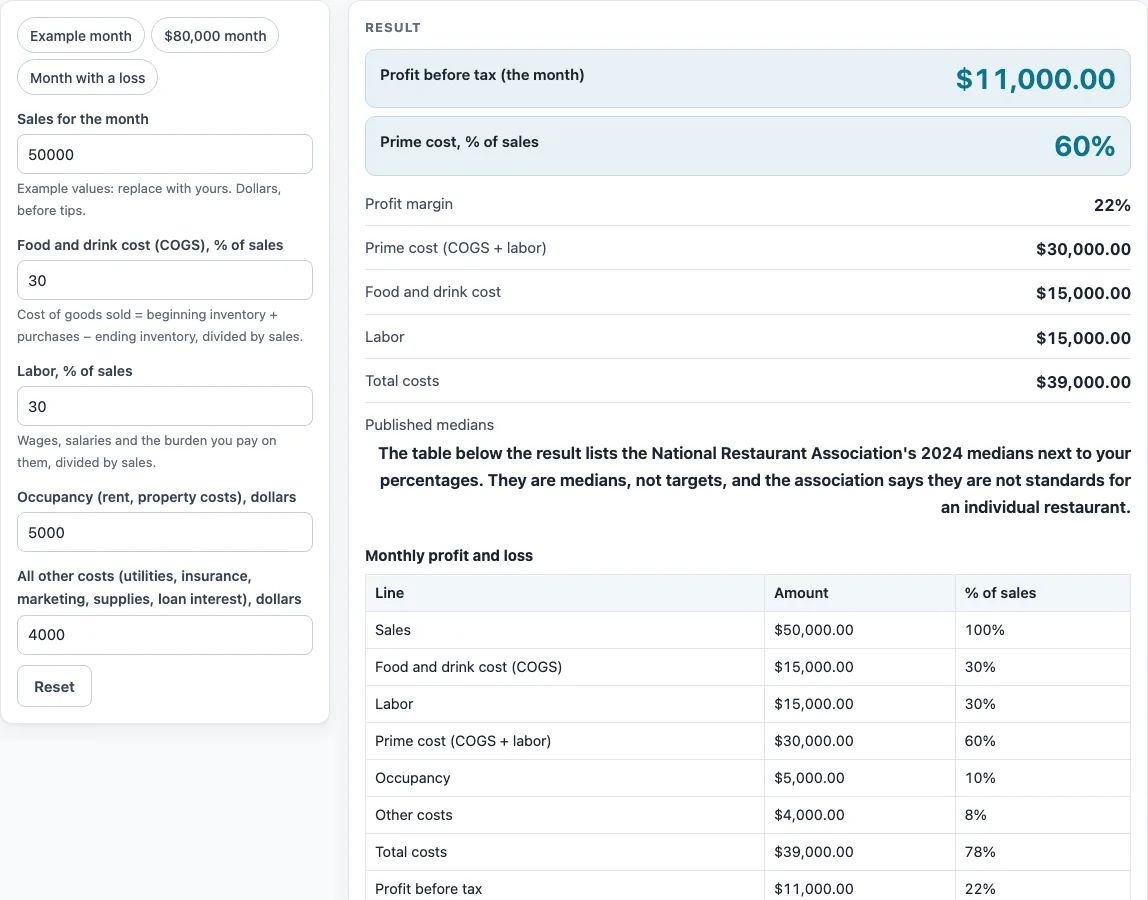
The form starts with round example values, so you can see how the numbers fit together before you replace them with your own. Every result is calculated from the figures you enter. Use it to test how a change in sales, food costs or labor would affect profit for one month.
How to use the Restaurant Budget Template
- Enter your sales for the month in dollars. The figure must be above zero.
- Enter your food and drink cost (COGS) as a percentage of sales. The tool turns this into dollars.
- Enter your labor as a percentage of sales. This is also turned into dollars.
- Enter your occupancy costs in dollars.
- Enter all your other costs in dollars.
- Read the P&L table. Each line shows its dollar amount and its percent of sales.
- Check the prime cost and profit results. If a warning appears, read it before you go on.
- Compare your COGS % and labor % with the medians table.
- Optionally, click “Example month”, “$80,000 month” or “Month with a loss” to load a preset and see how the results change.
If you enter a sales figure of zero or less, a non-numeric entry, a percentage above 100, or any negative value, the tool shows an error message. Correct the entry to continue.
The CSV button downloads the P&L table so you can open it in Excel, and the medians table stays beside your percentages. The percentages and dollar amounts in the form are example values to replace with your own month’s figures, so nothing in the result is a typical cost.
How do you calculate food and drink cost from sales?
Food and drink cost, shown as COGS, equals sales multiplied by the COGS percentage. If sales are $50,000 and COGS is 30%, the cost is $15,000.00. Labor is calculated the same way: sales multiplied by the labor percentage.
What is prime cost in a restaurant budget?
Prime cost is COGS plus labor. Its percentage is prime cost divided by sales. In the first example, $15,000.00 plus $15,000.00 gives $30,000.00, which is 60% of sales. The formula follows the Johnson & Wales University restaurant pricing guide.
How do you work out profit and margin for a month?
Total costs equal prime cost plus occupancy plus other costs. Profit before tax equals sales minus total costs. Margin equals profit divided by sales. In the first example, total costs are $39,000.00, profit is $11,000.00, and margin is 22%.
Why does a restaurant budget show a loss?
A loss appears when prime cost plus occupancy plus other costs is larger than sales. In the third example, sales are $30,000 with COGS at 35% and labor at 40%. Prime cost is $22,500.00, or 75%. Adding $6,000 of occupancy and $3,000 of other costs gives total costs of $31,500.00. Profit is therefore a loss of $1,500.00, which is -5%, and a warning says so. A warning also appears when COGS % and labor % together are above 100%.
How do the National Restaurant Association medians compare with your figures?
The second table places your COGS % and labor % beside medians for 2024 from the National Restaurant Association’s 2025 Restaurant Operations Data Abstract, which covers more than 900 operators. For food and non-alcohol beverage cost, the medians are 32.0% for full-service restaurants and 32.4% for limited-service restaurants. For salaries and wages including benefits, they are 36.5% and 31.7% of sales.
The association labels these figures as medians, not targets. It says they are not intended as standards or goals for an individual restaurant. Its definitions of each line may also differ from yours, so compare with care. This page does not say any percentage is good or bad.
What does a second example look like?
Try sales of $80,000, COGS at 32%, labor at 35%, occupancy of $8,000 and other costs of $6,000. Prime cost is $53,600.00, which is 67% of sales, and profit is $12,400.00, or 15.5%. These are example inputs, not typical figures for any restaurant. The sales, percentages and costs on the form are always the ones you type, so change each line to your own month and read the P&L table again to see how every figure moves.
Sources (checked 15 October 2026): online.jwu.edu · restaurant.org · restaurant.org
Worked examples
| Input | Result |
|---|---|
| Sales $50,000.00, COGS 30%, labor 30% | Profit $11,000.00 (22%) |
| Sales $80,000.00, COGS 32%, labor 35% | Profit $12,400.00 (15.5%) |
| Sales $30,000.00, COGS 35%, labor 40% | Profit -$1,500.00 (-5%) |
Calculated by the tool above; open it with the same values to see each step.
Frequently asked questions
Is this restaurant budget template free to use?
Yes. It is free, runs in your browser, and needs no sign-up. Nothing you enter is uploaded.
Do I need my real numbers before I start?
No. The form starts with round example values. Replace them with your own sales, percentages and dollar costs when you are ready.
What do the error messages mean?
An error appears for a sales figure of zero or less, a non-numeric entry, a percentage above 100, or any negative value. Correct the entry and the page will accept it.
Why did I see a warning?
A warning appears when the month shows a loss. It also appears when COGS % and labor % together are above 100%.
Does the tool tell me what a good food cost is?
No. The page gives no target percentages and does not say any percentage is good or bad. The medians table is there for comparison only.
Are the example numbers typical restaurant costs?
No. They are round placeholders so the sums can be seen working. The only published figures on the page are the National Restaurant Association medians in the second table, labelled with their source and year.
Can I take my results into a spreadsheet?
Yes. Use the CSV button to download the P&L table and open it in Excel.
Related tools
- Catering Calculator: Use it to estimate costs and pricing for events you cater.
- How Much Does a Food Truck Cost? Startup Cost Worksheet: Use it to plan the startup costs of a food truck before you open.
- Pour Cost Calculator: Use it to work out the cost of beverages you pour.
- Restaurant Labor Cost Calculator: Use it to look more closely at your labor costs.
- How Much Does It Cost to Open a Restaurant? Cost Worksheet: Use it to list the one-time costs of opening a restaurant.
- Restaurant Tip Calculator: Use it to work out tip amounts on a bill.
- Tip Pool Calculator: Use it to divide a tip pool among staff.
- Restaurant Costs: the hub page for all the cost worksheets and calculators on this site.